How to Determine Your Google Analytics Implementation Needs an Audit
Google Analytics is an essential tool for marketers and webmasters who understand where traffic is coming from, learn what visitors do when they get there, and determine whether or not your content is effective at helping you achieve your goals.
When used correctly, it can provide valuable insights that can be used to improve website performance and improve the return on investment of your marketing efforts.
Unfortunately, the data Google Analytics provides in its reports is often inaccurate or misleading due to lack of customization, gaps in maintenance, changes to your website, or problems with the tracking code.
Should You Trust Your Google Analytics Reports?
If you’re already asking yourself this, there is a good chance that something is wrong. Google Analytics should be trustworthy. To ensure that your data remains so, you’ll need to occasionally audit your implementation to identify potential problems, and address accordingly by correcting your implementation. Depending on the complexity and size of your website, this might be something you can do on your own, or you may need the help of professional analytics consultants.
A great place to start is to do a quick self-assessment of your data. Are key pages on your website missing from your reports? Is traffic from one city suspiciously high? Is your bounce rate too good to be true?
Below are a list of 9 tell-tale signs that your Google Analytics data is inaccurate and in need of an audit and re-implementation:
- Your Reports Aren’t Showing All Traffic
- Goal Completions Are Being Under-Reported
- Important Data Is Missing
- Spammy Data Is Appearing in Reports
- (Not Set) Appears as a Landing Page
- Self-Referrals Are a Top Source of Traffic
- Your Bounce Rate Is Low. Too Low.
- Pageviews Are Suspiciously High and You’re Over-Reporting
- Content Is Duplicated across Several Rows
1. Your Reports Aren’t Showing All Traffic
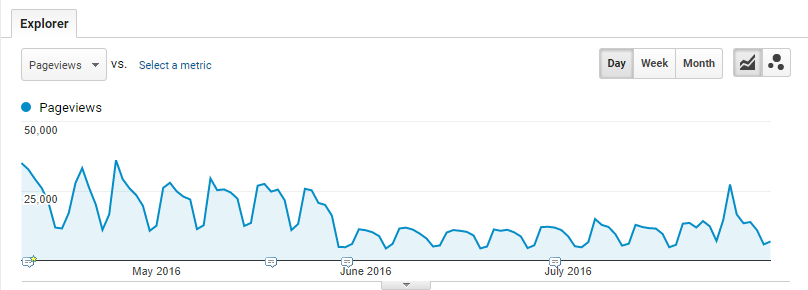
My Google Ads campaigns have been capturing 5,000 clicks per month on average – so why are my Google Analytics reports only showing 4,000 monthly visitors?
Websites change all the time. As templates are redesigned, and new features are introduced or removed, your Google Analytics code may accidently get dropped or modified, preventing your pages from being tracked.
If you have a larger website, this might be easy to overlook. By default, Google Analytics only shows seven days worth of data, so if the drop was more than a week ago, you might not notice it. That’s why we recommend doing year-over-year comparisons as well as week over week, and checking your data regularly. If you do this, you may notice there was a significant drop.
Possible Problems to Investigate:
- Is a new template missing your Google Analytics or Google Tag Manager code?
- Is the code placed on the page exactly as guided by official documentation?
- Are other scripts preventing Google Analytics from loading correctly?
2. Goal Completions Are Being Under-Reported
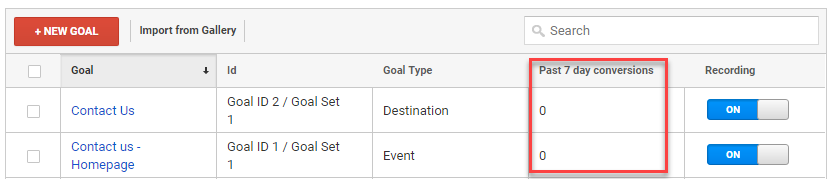
I know we’re getting more leads than that. Why does Google Analytics showing only a fraction of the goal completions I know we’re capturing?
If it’s been 6 months or so since you set up all of your Goals, or even longer, there’s a very good chance something has changed on your website that has caused that goal capture to break.
This is especially true if you’ve tied your goal to a funnel with multiple steps.
As marketers look for ways to improve performance and capture more leads, they’ll often change URLs, add or remove steps in a funnel, or even change the button text on a call-to-action. These are all specific items that your Goal configuration may be depending on. As soon as something changes, it risks breaking your implementation.
Possible Problems to Investigate:
- Are any of your goals showing zero completions in the past 7 days? 30 days?
- When you try completing the goal, do you see a goal completion appear in your Real-Time reports?
- Is it possible that your third-party data (Facebook, Google Ads, etc.) is overreporting or improperly configured?
- Is it possible that your users are converting multiple times in a single visit? Google Analytics will only capture a goal completion the first time it occurs.
Get A Complimentary Google Analytics Health Check
Wondering if there is a problem with your Google Analytics data? Find out with a free assessment from one of our experts.

3. Important Data Is Missing
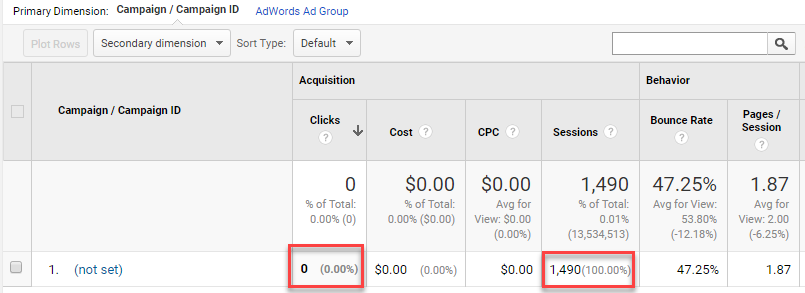
My Google Ads report is showing thousands of sessions, but there are zero clicks.
There are several popular reports in Google Analytics where data may appear to be missing. More often than not, this is due to a missing integration between your property and a third-party data source like Google Ads or Google Search Console.
Another common, but more challenging issue to resolve, is missing event data. This happens when css or other code changes on your website.
Possible Problems to Investigate:
- Are all of your Google Ads accounts linked to your property?
- Is the right Google Search Console property linked?
- Is your event tracking properly configured?
4. Spammy Data Is Appearing in Reports
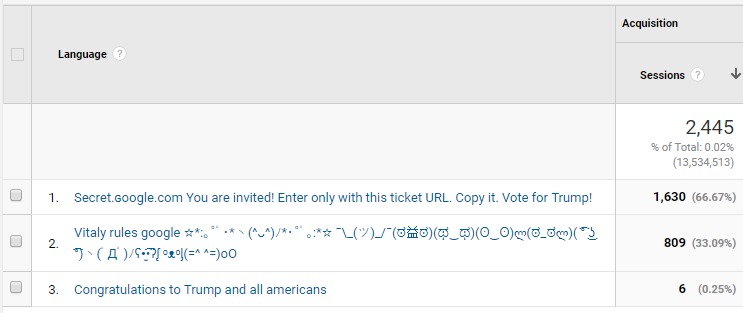
Why am I seeing a “Vote for Trump!” and “Vitality Rules” messages in my language reports?
It’s a sad thing to admit, but we must—there are plenty of people in this world that get a kick (and make a few bucks) spamming websites, email inboxes, and even your Google Analytics data.
Spam traffic tends to appear most often in referral, event and language reports in Google Analytics. This might seem harmless at first, but there’s a good chance this fake traffic is seriously skewing your data – making you believe that your website is performing much better or much worse, than it actually is. Fortunately, it’s pretty easy to strip these things out with some simple filters and settings.
Possible Problems to Investigate:
- Are there strange messages appearing in your acquisition, events, or language reports?
- Is “c” a common language in your language reports?
- Is the “Bot Filtering” checkbox selected in your admin settings?
- Have you configured any custom filters to exclude this traffic?
5. (Not Set) Appears as a Landing Page
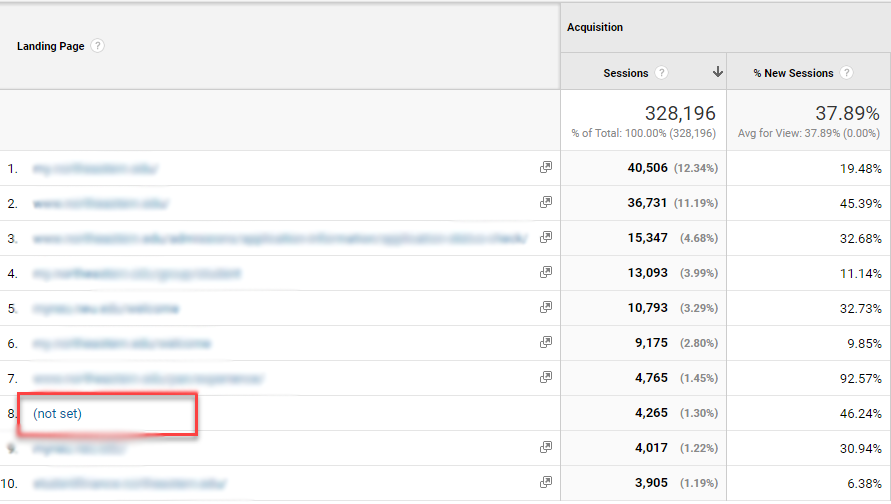
Why is (not set) my second most viewed landing page? What does not set mean?
Not set indicates that a value Google Analytics expected to for a dimension was never provided to Google Analytics, and therefore note set. When you see this in your reports, you can be confident that something is wrong.
Not Set can appear virtually anywhere in Google Analytics, but the Landing Page report is the most common.
This tends to occur when an event or other hit is being sent to Google Analytics prior to a pageview, which breaks the session. It can also occur when a session expires due to 30 minutes of inactivity (imagine someone watching a 45 minute webinar on your website,) and then initiating a new session by interacting with another element of the page.
When you see (not set) appear, it’s usually a good time to bring in an implementation expert.
Possible Problems to Investigate:
- Does a page on your website have an element like a video that would cause someone to pause activity for over 30 minutes?
- Have you blocked certain pages from triggering a pageview? Is it possible those pages are still triggering events?
- Are you mixing old versions of Google Analytics with the new Universal Analytics tracking script?
- Was your Google Tag Manager implementation set up by a professional?
6. Self-Referrals Are a Top Source of Traffic
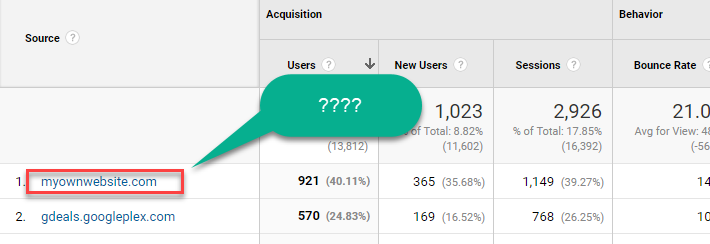
Why is my own website my top source of traffic?
If you’re looking at your referral report and see your own domain in the list, you can be confident that something’s wrong.
When you own website refers traffic to itself it is known as a self-referral. Self-referrals are an extremely common problem—especially with larger websites managed by multiple teams and departments.
This is bad because a self-referral essentially blocks you from seeing anything that happened in that users session prior to the point your website set itself as a the referrer. This means that you’re unable to see the original traffic source and medium, their true landing page, and the true path they followed on your website.
It can be caused by gaps in your implementation or improper setup of cross-domain tracking. This tends to a problem that can significantly skew your data and should be addressed once identified.
Possible Problems to Investigate:
- Is the tracking script placed on all pages of your website?
- Are you directing users to a third-party domain that you can’t track with Google Analytics?
- Have you properly set up referral exclusions in your admin settings?
7. Your Bounce Rate Is Low. Too Low.
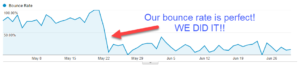
Damn…. A 5% bounce rate?? That’s pretty good!
It would be if it were accurate. It’s rare that a bounce rate falls much lower than 40%. Bounce Rate is the percentage of visitors that leave after viewing a single page of your website, or after a single hit was sent to the server. If you only have a bounce rate of 5%, you’re either do incredibly well at engaging your visitors, or something’s wrong.
Usually this is a sign that there are events being triggered without requiring the user interact in any way – perhaps when an interactive element loads or a video automatically plays.
If you find this is true, you’ll want to either block those events from triggering, or set them as non-interaction events so they don’t unintentionally deflate your bounce rate.
Possible Problems to Investigate:
- Is a plugin or widget triggering events?
- Are events that occur automatically (without interaction) set as non-interaction?
- Does the tracking script appear twice?
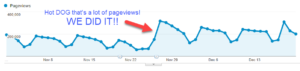
8. Pageviews Are Suspiciously High and You’re Over-Reporting
Hey look, our pageviews skyrocketed the same day our bounce rate went down! That’s awesome, right?
No sir, it isn’t. This is probably happening because your Google Analytics script is placed twice on the same page, and you’re doubling up your pageviews with every visit.
This doubling up of the tracking script can occur because a developer decided to move the script and forgot to remove it from the old location, or when someone installs a WordPress plugin that automatically inserts the tracking script.
An inflation of pageviews can also be triggered by an iframed form or other html element.
You want pageviews to be a good indicator of how many pages on your website a user interacts with, so you really want this metric to be accurate. Don’t let his sit for too long.
Possible Problems to Investigate:
- Is the tracking script placed only once?
- Is the tracking script placed in a single location?
- Does iframed content trigger a pageview? Should it?
- Is there a loading issue forcing the user to reload the page multiple times?
9. Content Is Duplicated across Several Rows
Why is Google Analytics saying we have 246 pages when there’s only 80 on our entire website?
By default, Google Analytics will report on any unique URL, whether it is truly a unique page or not.
This means that if one user types in yourdomain.com/CheesyBuritos and another types in yourdomain.com/cheesyburitos and yet another types in yourdomain.com/cheesyburitos.php, you’ll see three separate pages reported in your All Pages report even though all three of these variations are the same thing.
While not necessarily inaccurate, this duplication of data can make analysis more difficult, as you’ll have to segment data across multiple rows instead of just one. It might be better to consolidate by applying filters that force all rows to lowercase, strip extensions, and add a trailing slash to the end of each row.
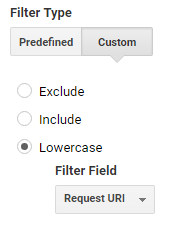
Possible Problems to Investigate:
- Do you link to pages on your website in a consistent way, or do some use capitals and others all lowercase?
- Have you configured any custom filters to clean up your data?
- Is a single piece of content accessible via multiple URLs?
Don’t Make Bad Decisions from Bad Data
If you’re finding any of these issues in your reports and data, or you’re seeing something else that just doesn’t feel right, or looks suspicious, you’d be well served to act now rather than waiting to later.
Data captured by Google Analytics is permanent. You can’t go back and clean it up later. This means that the longer you let a problem persist, the larger the dent in your analysis capabilities will be. Audit your data regularly and continuously make improvements to your implementation and you’ll benefit with better data, more insights and smarter decisions.
Seeing something strange in your data? Have a fun spam traffic example to share? Let us know in the comments!