
Written By:
Sean Henri
Analyzing The Impact Topic Clusters and Pillar Pages Have on SEO, Traffic, Website Engagement and Conversions
For years, advanced SEO’s have known that in order to rank well, you not only need to create amazing content, you need to need to create content that serves the searcher’s intent. Simply help the searcher achieve their goal, and you’ll be rewarded.
The problem was that many people conducting a search don’t actually know what they are looking for. Often someone will do a broad search, only to refine it with a more specific one after the first page of search results left their needs unfulfilled.
Google responded to this in two ways:
- Adding related search suggestions and “People also ask” boxes
- Rewarding content and websites that answers the searcher’s query AND anticipate what other questions that searcher is likely to have, and answers those questions proactively.
SEOs responded by using links to group content into “silos”—narrow verticals or categories of similar content that addresses a topic comprehensively in a series of more targeted blog posts, website pages and content. This helped search engines understand the semantic relationship between sub-topics and content, helping to position the website as an authority on the term. Google rewarded websites that did this because they could help their searchers achieve their goals in a single stop, rather than having to jump from search to search, site to site.
The smart people at HubSpot caught on. They tried it themselves, and saw insane growth in their organic rankings, traffic, and on-site engagement as a result. A lightbulb went off. They asked themselves, “how can we bring this approach to the masses, and in doing so build demand for our marketing software?”
Take the Guesswork out of Inbound
Receive a detailed Inbound Marketing Strategy in 30 days or less.
The result was a content marketing and SEO tool called Content Strategy, and two brand new terms for an approach that had been around for years: “Topic Clusters” and “Pillar Pages.” A new SEO trend was born thanks to HubSpot’s mass reach and influence amongst marketers. Fortunately, it’s a darn good one.
Whether you call this strategy topic clusters, content silos, pillar pages, cornerstone content, or something completely different, it’s a strategy that works and can produce amazing growth in your organic search rankings and traffic.
But measuring the impact of this strategy is easier said than done. The problem is that most tools and analytics platforms are centered on the idea that performance should be measured by a page by page, source by source basis.
This makes it difficult to measure the impact of a broad cluster of content around a high-level topic.
Fortunately, we have two super-easy ways to aggregate all content that’s included as a part of your topic cluster into easy-to-understand reports and dashboards.
Without further ado, here is a step-by-step guide to measuring the performance of your topic clusters and pillar page content:
Using HubSpot’s Content Strategy Tool
The Content Strategy tool in HubSpot is designed from the ground up to help marketers research, plan, execute and measure their topic cluster and pillar page content strategy.
HubSpot believes that is marketers produce blog content in a more thoughtful, structured way, their customers will be more successful with their blogging, content marketing and SEO efforts. This tool is designed to help them do just that.
Because the tool is integrated with the rest of HubSpot’s platform, including contacts, you can easily measure the impact your topic clusters have on increasing traffic, capturing new leads, and how many of those leads turn into customers. This offers you a perfect view into the ROI of your efforts.
It provides you with useful metrics like topic relevance, search volume, and month-over-month traffic comparisons, allowing you to gauge potential before you even commit to a topic.
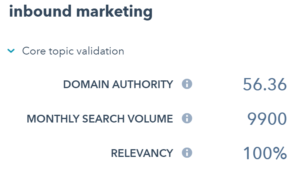
Once your topics have been running for a few weeks, you can use the new Traffic Analytics report to dive in much deeper into your clusters.
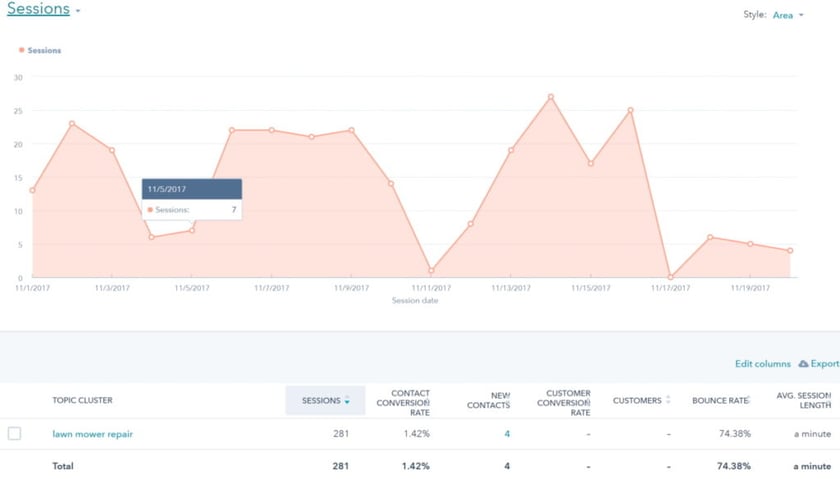
With metrics like sessions, new contacts, new customers, and their conversion rates, you can easily see which topics are filling your funnel, and which aren’t. Metrics like Bounce Rate and Avg. Session length can clue you in on what content is performing well, and what should be improved. Think of a high bounce rate and low session duration as a warning sign that your content isn’t very engaging and should be improved – especially is your conversion rates are low as well.
Clicking on a topic will allow you to see each individual topic (usually a blog post,) giving you the ability to analyze these metrics on a page-by-page basis.
But what if you want to drill down further? Let’s say you notice a blog post has a high bounce rate, but you want to see if there’s a difference between mobile readers and desktop readers, or, you’d like to understand if there are any major differences between organic search performance and social. Unfortunately you won’t be able to do this deep dive in HubSpot, which is why we recommend measuring topic clusters in Google Analytics as well.
Using Google Analytics For A Deeper Look
Google Analytics has a feature called Content Groupings designed to allow you to group your content into logical structure that allows you to analyze performance in the way both you and your users think about your website.
This makes it a perfect tool for capturing and analyzing topic clusters!
For this to work, you’ll need to have done a bit of planning and organizing beforehand. If you haven’t already done so, create a spreadsheet that groups ALL of your content by topic. If you’re doing this for the first time, you might benefit by brainstorming what topics you should have first, and how that might come together (topic – sub-topic 1, sub-topic 2, etc.,) rather than looking at all of your content and seeing what topics they form. This will keep your structure more strategic and focused on what you should be doing rather than what you’ve done in the past.
Once done, you’ll have a spreadsheet that breaks out each URL with a topic. You’ll be doing a lot of copying and pasting in the steps ahead, so keep this spreadsheet handy. Let’s begin:
Step 1: Configure Content Grouping Settings
Log-in to your Google Analytics property, and navigate to the Admin area. Select the view that you wish to create your groupings under, and then select Content Groupings. Click the red button that says +New Content Grouping.
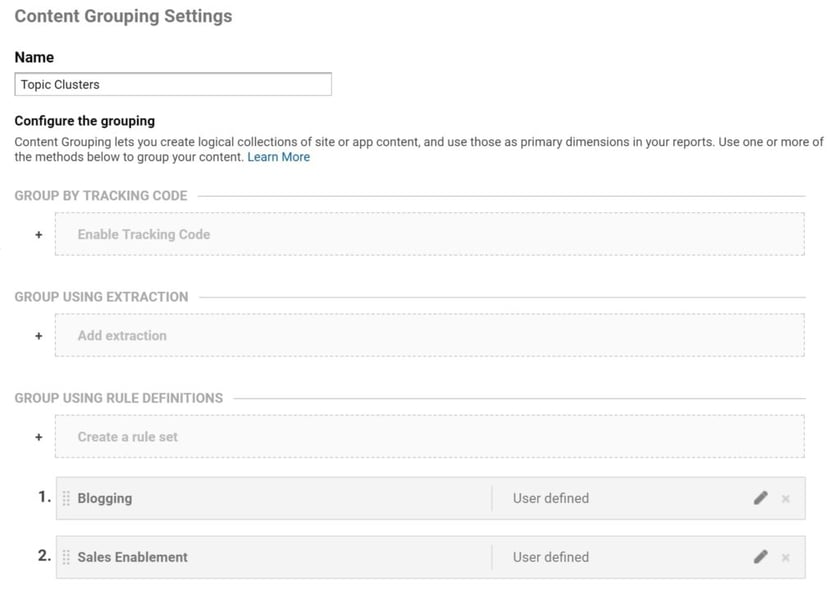
First, name the new grouping “Topic Clusters” or something similar. Then, you’ll need to identify how you wish to group your content.
You’ll be given three options:
- Group By Tracking Code
- Group Using Extraction
- Group Using Rule Definitions
The third option, Group Using Rule Definitions, will likely be your best bet, and it’s my personal favorite because of the level of control that you gain by using this option. However, if you have carefully planned out your URL structure – mapping topics to category or topic-based folders – Group Using Extraction might be an easier path. In the next steps I’ll assume that you’ve chosen “Group Using Extraction.”
Step 2: Create a Definition to Group Each Cluster
Get ready to start clicking ctrl+c and ctrl_v, because you’re about to do a lot of copying and pasting!
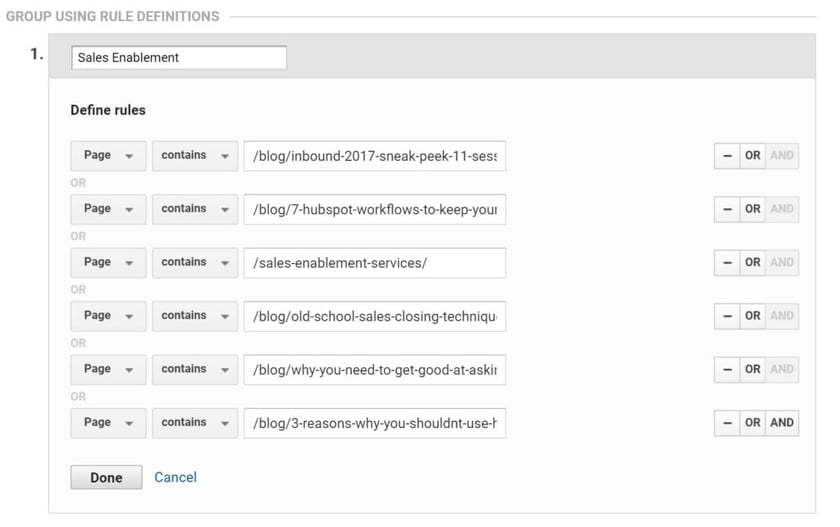
To define a cluster, you’ll need to create a rule for each one. Let’s say you had a cluster for “Sales Enablement.” The name of the definition would become “Sales Enablement,” and you would then create a rule for each page URL included in that cluster.
The screenshot below illustrates what this might look like. Be sure to use contains rather than exact rather than exactly matches to
Step 3: Analyze Your Data
Once you have defined all topic clusters and fully configured your content groupings, Google Analytics will begin to provide data for this groupings from that day forward. You will not be able to view data by topic cluster prior to the date you configured it, so you’ll want to set these up as soon as possible.
Wait about a week or so, and there should be enough data to make it worth diving in.
Simply navigate to any content report like All Pages or Landing Pages, and you’ll see a list of URLs like you normally would. To change the view so that you can see your topic clusters, click the “Content Grouping” option towards the top of your report, and select your topic cluster grouping. This will show you a view that looks something like this:
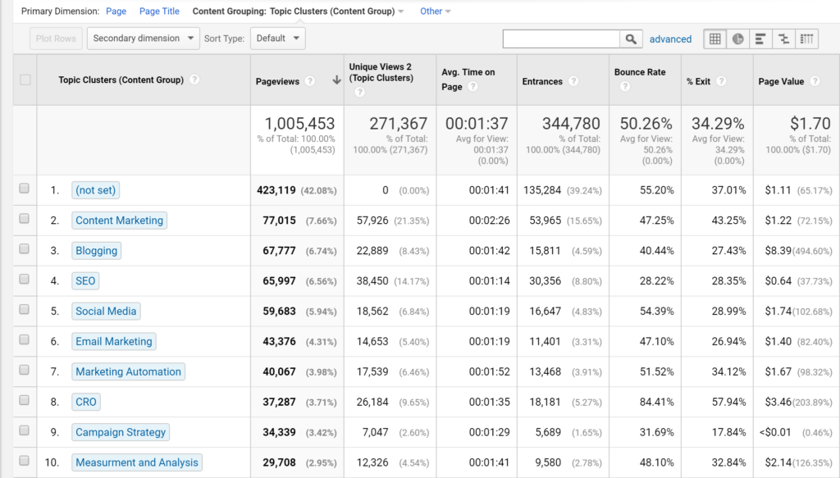
Here’s where the real magic begins. Without any additional segmentation, you already have many more metrics than you would get from HubSpot, such as Page Value, %Exit, and Avg. Time on Page. You can also drill down into performance by any of the 20 goals made available to you in Google Analytics, giving you goal completions, goal conversion rate, and goal conversion value by topic cluster.
You can take this one step further by adding a secondary dimension. I recommend exploring source/medium, campaign, device type, and new vs. returning users. This may help you uncover optimization opportunities you wouldn’t have seen otherwise.
Step 4: Create Audiences For Deeper Analysis and Remarketing
If you would like to explore how your topic clusters influence their entire journey on your website, you can easily do so by creating a custom segment.
Towards the top of any report, click +Add Segment and you’ll be brought to a screen that looks like this:
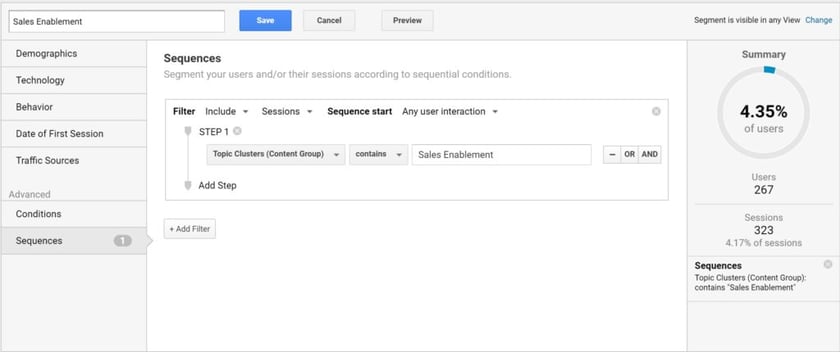
Navigate to Sequences, and select your desired topic cluster as the first step. To only segment visitors who started on a topic cluster page, change the Sequence Start option to “Any user interaction.”
Once your segment is created you can apply this to any report in Google Analytics and it will restrict the data to that specific segment.
You can also use this new audience to re-engage visitors, pulling them back to your website after they left, by using Google Analytics’ integration with Google Ads remarketing feature. You might this capability to target a segment of users who visited one of your topic clusters with a related top of funnel content offer. This is a tactic we use often and have seen great results with.
What Can You Learn By Analyzing Your Clusters?
The value of measuring and analyzing the impact and performance of your topic clusters might be obvious. By analyzing the outcomes of your efforts, you can show the impact you’re having on organizational goals, and justify further investment into the approach.
Measurement and analysis should also be an important tool for improving the effectiveness of your efforts. By following the steps above, you’ll be able to uncover very specific things you can do to improve the reach and impact of your content, such as making content more mobile friendly, replacing underperforming offers with more relevant ones, and knowing when a topic cluster requires that you go more in depth.
The earlier you begin, the more data you’ll have to work with, so go ahead and get started today.


