The Google Analytics KPI Dashboard helps you and your team focus in on the metrics that matter from your Google Analytics account. It helps you measure, monitor and act upon the key outcomes that your website was designed to create, as well as the leading indicators that help pinpoint where your greatest opportunities lie.
It incorporates many of the most widely relied upon Google Analytics metrics, such as Sessions, Users, % New Sessions, Pages/Session, Pageviews, Conversion Rate, Goal Conversions, Goal Conversion Rate, Bounce Rate, and Pageviews.
It also allows you to benchmark your performance month over month, year over year, or against your own pre-determined goals.

Downloading the free template is a great first step towards making your team more data-driven and aware of what’s working on your website and what isn’t—but when I say first step, it’s just that: A first step. There’s more you need to do.
Should You Trust Your Data? Find out with a Free Review
Many Google Analytics implementations are flawed, or incomplete, leaving data inaccurate and confusing. Find out the health of your account by booking a free review with one of our certified Google Analytics experts.

To get the most value out of your dashboard, you’ll need to make some customizations, configure some options, and most importantly, get it it into the hands of your team. Read on to learn about 5 customizations that will help you get more value out of your Databox dashboard.
1. Make it match your brand
Before you put your beautiful new dashboard (Databox calls them Databoards) up on the flatscreen or start sharing the link around to your team, you’ll want to make a few quick customizations to make it feel like it’s been customized for your company.
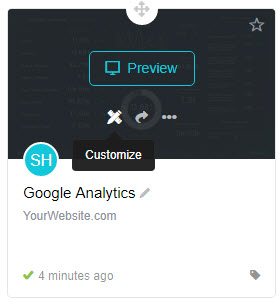
Databox makes this extremely easy using their Designer tool. When viewing your list of available Datawalls, simply hover over the Google Analytics Datawall and click “Customize.”
This will open up the designer view, which will look something like this:
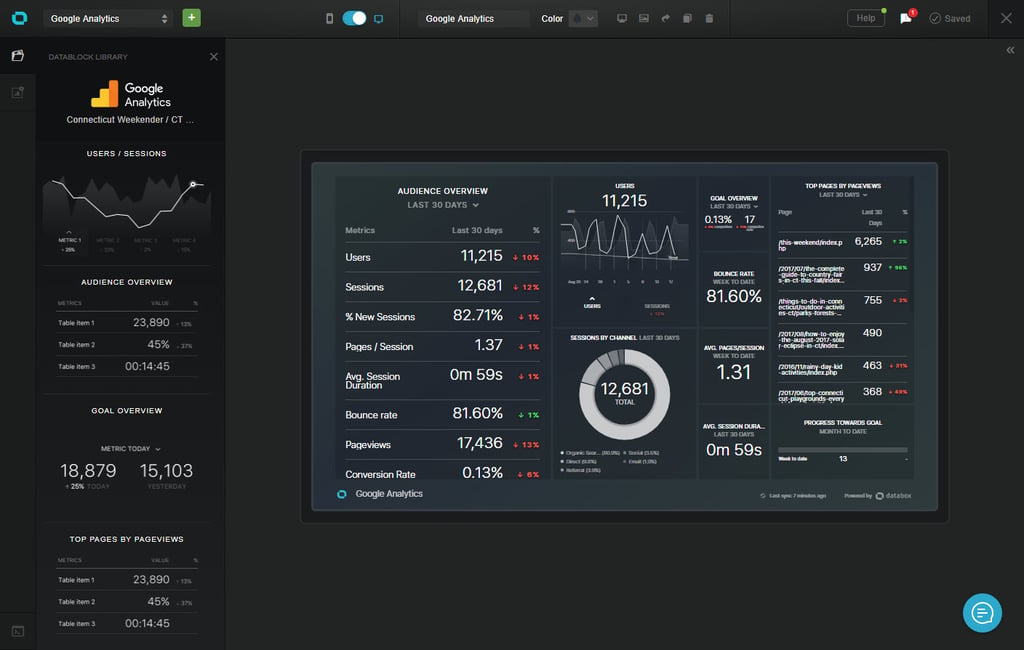
This is where you get to do all of the fun stuff, and really make your Datawall stand out. Towards the top of your screen, look for the icon that looks like a picture.
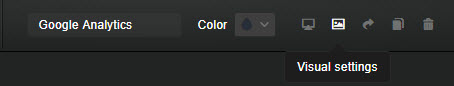
Clicking this icon will show you options for selecting a color, uploading your logo, and uploading a custom background image.
Tip: Consider uploading an all-white version of your logo with a transparent background. This will help it stand out against the colored background while hopefully not violating your brand guidelines.
2. Customize the metrics your dashboard displays
We took a guess at the metrics you might value most based on their popularity with Google Analytics users, but you that doesn’t mean they are the right ones for you. Swap out metrics in the Audience Overview block, or in other blocks, so that the dashboard displays the key performance indicators (KPIs) that are best aligned with your organization’s website strategy.
To do this, simply click on the block of data you wish to edit. This will open a Table Properties panel on the right-hand side of your screen.
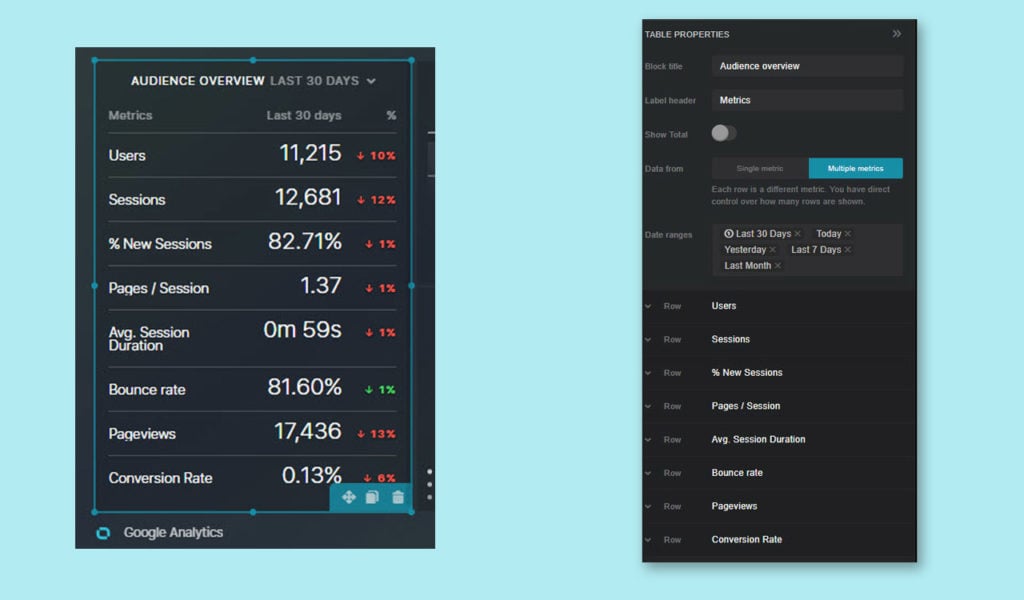
From the Table Properties panel, you can replace/re-label each metric, swap out displayed Date ranges, and rearrange their order in the table.
If a certain block of data is particularly valuable and you would like to make it more prominent, you can extent its size or re-arrange on your dashboard simply by dragging the borders.
3. Set custom goals for each KPI
A bunch of metrics displayed on a well-designed dashboard might be interesting to look at, but they won’t drive action if your dashboard fails to relate the numbers to your organization’s strategic goals.
Fortunately, Databox allows you to set goals for nearly any metric it displays, and setting them up is super easy.
Just click the block you wish to set a goal for, then look for the “Goal Value” area, and follow the prompts.
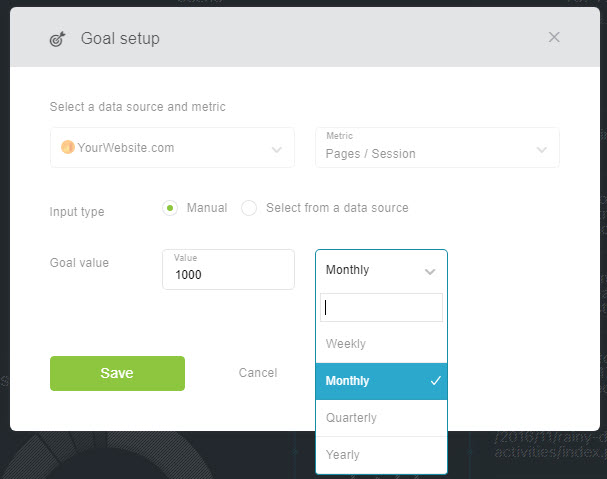
From this screen you can select Weekly, Monthly, Quarterly or Yearly. If you have a long sales cycle, you may want to opt for the longer periods.
4. Import Your Custom Goals
By default, we chose to display conversion rate for all Goal Completions in your Google Analytics property. You will likely want to replace this with the most significant conversion your site aims to trigger.
This requires that you create a custom query using the Databox Query Builder. This is really easy once you’ve done it once or twice, but you may want to read through this help article the first time around.
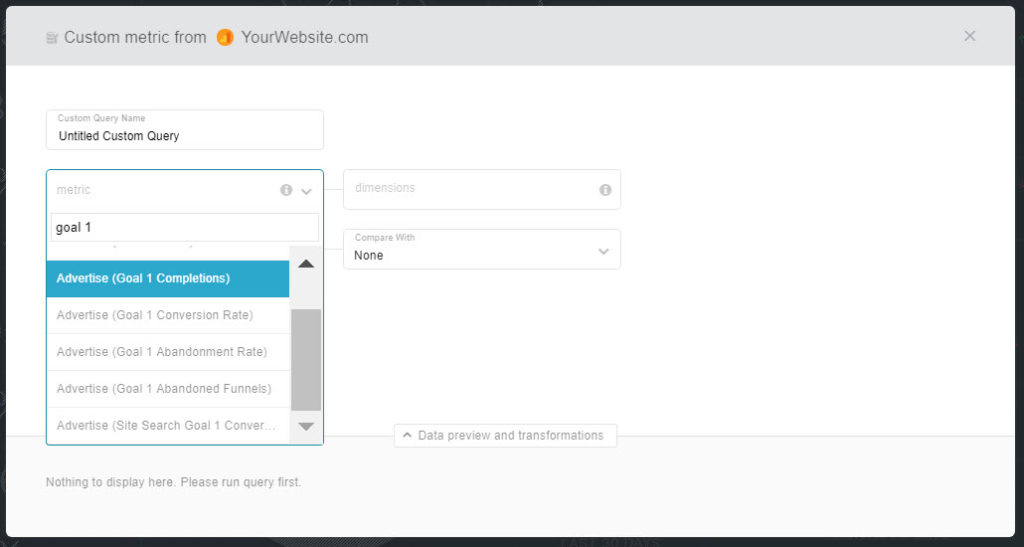
As you can see in the screenshot above, the process for importing your custom goals as custom queries is pretty intuitive and should only take a minute or two to set up.
5. Share It With Your Team
Last but not least, you’ll want to share this with the rest of your team so you can reap the true benefits of your new dashboard. Sharing your Datawalls widely will improve alignment, motivate your team to hit your goals, and help you identify areas of opportunity faster than ever before.
Be sure to add additional users to your portal, and give the team a quick training on how they could install and configure the mobile app, trigger alerts, create scorecards, and what each of the displayed metrics mean.
By completing these quick customizations you’ll see significantly more value from you new dashboard and your team will will love what they see. Good luck!