As a marketing manager presenting during monthly meetings, it’s important that you’re able to provide insight with the data that you’re presenting. Your peers need to understand what the data implies and why it’s important to the organization.
Here, you’ll learn:
-
What not to do during meetings and what your agenda should look like
-
What data-driven marketing is and why it’s important
-
How to make your monthly marketing meetings more data-driven
The other day I was thinking about an old job I had before starting Pepperland, back when I was a Digital Analytics Manager at a large multinational corporation. In my role, I was tasked with helping the marketing team that I was a part of learning how to leverage analytics and become more data-driven.
I think I did a decent job at it, but as I reflect on how I handled things through the lens of what I know now, I’m a bit embarrassed by some of the mistakes I made.
One example was how I presented data at our monthly “MOR” meetings (short for monthly operating review) and quarterly “QORs” (quarterly operating reviews). Pressured to simply get the word out on “what happened,” I’d use my slides to present the data and trends. “Here’s how many visits we got.” “Here’s how many visitors turned into leads.” No story behind the data.
No insights. No explanations. No thoughts about what could be done differently.
There wasn’t a single thing that I was measuring and presenting that I had direct or primary responsibility for improving.
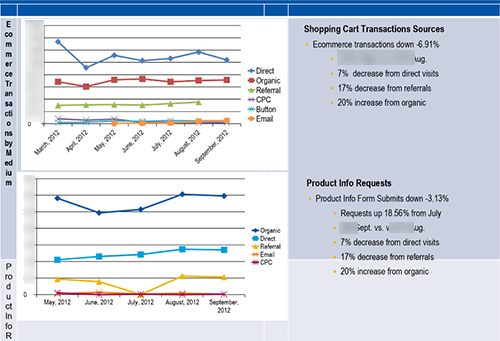
One of my old slides. Sigh.
The result? My boss seemed excited that these monthly meetings finally included metrics and data (at least initially), but my peers seemed less than thrilled. I could feel people in the room cringe when it became my turn to speak as if they were about to be publicly shamed.
Rather than using my time to present the data, as though I was some oracle who could see things that nobody had access to, I wish I focused my time discussing the why behind the data. Why are these numbers and trends important for the organization? Why did we see significant changes in our KPIs? It’s not enough to just regurgitate a list of numbers; you need to dig a bit deeper and provide insight.
My hope is that by sharing these reflections, those who are reading this and in a similar role can facilitate more data-driven marketing meetings and hopefully avoid making some of the same mistakes I made.
What is data-driven marketing and why is it important?
Simply put, data-driven marketing focuses on using data to make informed strategic decisions. Typically, data-driven marketers analyze data to gain insights into customer behaviors so that the organization’s marketing strategy can be supported by numerical evidence.
While it’s important that marketers use data to guide their marketing efforts, it’s also crucial that they’re able to use data to speak to the results of their efforts. You need to be able to analyze performance data and determine why the data is changing, whether marketing is on track to meet its goals, and what the department needs to do to either maintain or improve performance metrics. Most importantly, you need to be able to speak to the value of marketing for the organization as a whole.
After analyzing the data, gaining insights, and making inferences, you need to share these findings at your monthly marketing meetings so your peers can be well-aligned with your strategy and senior leadership will understand how you’re impacting the bottom-line.
Use our Marketing Contribution Calculator
An easy-to-use, marketing contribution calculator that will automatically set your targets for you.

By conducting data-driven marketing meetings, you’ll successfully communicate to your organization what’s happening, why it’s happening, why it’s important, and what should occur going forward.
Below are some simple ways you can make your marketing review meetings more data-driven.
Making Your Marketing Meetings More Data-Driven
1. Follow a meeting agenda.
To facilitate your data-driven marketing meetings, you might want to follow a specific meeting agenda to guide your discussion. If I were to step back into my old role today, here’s how I might advise my peers to prepare their own slides and notes for the meeting.
Marketing Meeting Agenda
- A quick review of KPIs. Did we hit the goal? How far over/under? Time: 2 Minutes
- What worked well? Where was the primary improvement compared to the previous month? What steps can be taken to continue or strengthen this trend in the month to follow? How is this trend contributing to larger business goals? Time: 4 Minutes
- What fell short? What performed below expectations? What lessons were learned from it? What is going to be done differently in the month ahead to course-correct? Time: 4 Minutes.
- (Optional) Things to brag about. Most people take pride in their work and want an opportunity to show off a little. If time allows, build this in. Otherwise, cut it and find other opportunities to showcase the fun stuff. Time: 5 Minutes.
- Peer Feedback. This is an opportunity for others to react to the data and the insights provided. Time: 5 Minutes
2. Use Meetings to Focus on the Outliers.
Being data-driven means that you are driven by the data. “Driven” implies action.
The only way you can take action from data is if you know what needs to be improved or corrected. An easy way to do this is to find the outliers or anomalies in your data. Outliers make it glaringly obvious where your strengths or weaknesses lie for the month and give you a talking point for your meeting.
Tip: An easy way to quickly identify outliers in Google Analytics is to change the report from the default view to the “Comparison” view. This will provide you a visual of which rows performed better or worse than the site average. The larger the bar, the greater the variance from the norm.
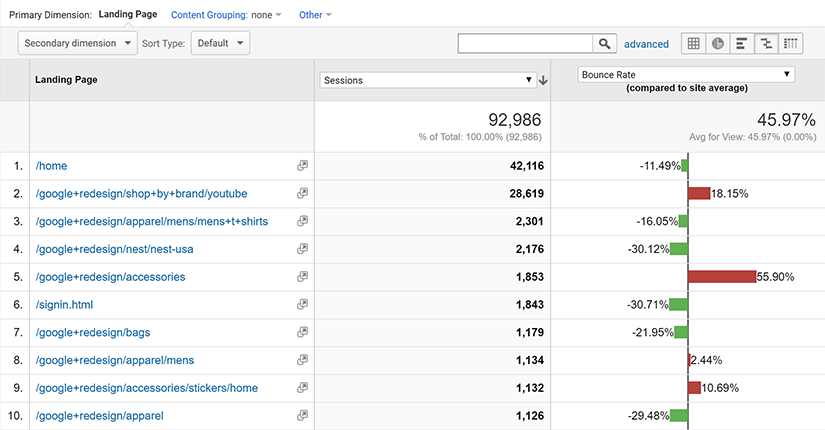
Once you have identified the outlier, click on that row, and add a second dimension to try to identify why that segment underperformed. Was it a problem with mobile-friendliness? A new referral source that generated low-quality traffic?
If you’re more analytically adept, I recommend reading Avinash Kaushik’s article on leveraging statistical control limits as an additional way to identify outliers.
3. Encourage A “Top-Down” to “Bottom-Up” Measurement Framework
At the end of the day, a business exists to make money. As a C-level executive, there are likely only a few metrics that will indicate the health of a business, and whether or not the organization is hitting its goals.
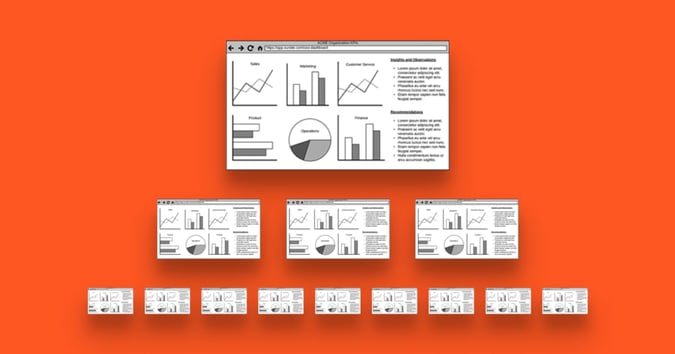
If meeting discussions are focused on the outliers and actions that will be taken as a result of them, there’s no need to include more than a few primary KPI’s in the c-level’s dashboard. But by eliminating the noise, the people in the room still need to be prepared to explain the underlying factors that contributed to a goal being met or missed.
This requires that a review of a more granular set of data occurs prior to the C-level meeting. Essentially, data from lower levels in the organization should be rolling up, in stages, from the very bottom to the very top.
In order for this to happen effectively, you need to first establish S.M.A.R.T. goals based on the organization’s top-level objectives. This means that in order to have data flow from the bottom-up, you first need to plan from the top-down.
Let’s say the organization sets a goal of increasing revenue by 20% in the year ahead. Here are some goal-setting questions that could be asked from senior leadership all the way down to the individual contributor level:
- C-Level: What percentage of this should come from new business?
- Sales/Marketing VP: If our average deal is worth 50K, how many deals do we need to close in order to hit 20 million? How many deals will we have to work to hit that goal? How many qualified leads would we need?
- Marketing Manager: How many leads and visits will we need to capture in order to hit our qualified lead goal? How would this need to breakdown by market segment, acquisition channel, or campaign?
- Email Marketing Specialist: How many clicks from email do we need to generate in order to hit our conversion goals? How much does the database need to grow in order to hit that number? What does our click-rate need to be? What about our open rate?
This approach should lead to the creation of a meaningful hierarchy of key-performance-indicators, or KPIs, that should be measured at each level in the organization—each set rolling into a higher-level KPI, helping to explain why the higher-level metric is what it is.
This also helps those who are lower in the organizational hierarchy more clearly tie their actions back to revenue. It helps create a more direct line from a Facebook Page Like to a won deal, or an increase in search rankings to an uptick in qualified leads.
This approach makes marketing’s contribution to business goals much more apparent.
4. Set up customizable dashboards for your team.
When I first stepped into an analytics role, I often felt perplexed as to why my peers weren’t embracing the powerful measurement tools that were being made available to them. As I think about it now, I believe it was partially due to the lack of training and education on what the data meant, and how it could be used. Another factor may have been doubts about the accuracy of the data (something we at Pepperland can help with).
I think the biggest hesitation came from the fear that data would suddenly shine a light on failure that had gone undetected until it was too late to do anything about it.
If you’re only pulling up your reports and dashboards on a monthly basis, you’re setting yourself and your team up for many painful surprises. This is a good way to ensure people WON’T be excited about the data.
Today, data has become so accessible there’s really no excuse for your team to not be able to walk into the office every morning, and within 10 seconds or less immediately know if they’re hitting their goals or not. Tools like Databox allow you to create customized dashboards that display data in real-time from nearly every tool a marketer uses – Facebook, Google Analytics, HubSpot – you name it.

In our agency’s office, we have a flat-screen TV that rotates through several Databox “datawalls” throughout the day. We’ll often break into a conversation around a new content idea that’s triggered when we see a new keyword emerge on our Google Search Console dashboard, or when we see a conversion rate dip in our HubSpot data. It’s allowed us to gather insights and react in real-time, so there are never any surprises.
Using Data to Your Advantage
I’m confident that the ideas above will help you and your organization become more data-driven and hold more meaningful monthly meetings, as I’ve experienced it first hand.
By digging deeper and providing insight into the numbers, your peers will have a good idea of what’s working, what’s not, how this is impacting the organization, and what adjustments need to be made.
To help you understand how your efforts impact the organization, we’ve created a free Marketing Contribution Calculator. Simply plug in some numbers to this calculator to determine how marketing is contributing to business goals.
This might be a nice starting point for your next monthly marketing meeting.